Independent Market Research · Education & Analysis ARETÉ Research · ARETÉ Education
The Methodology

Tesseract: organize the market.

Tesseract is an organizational framework — a way of arranging everything the market tells you (structure, liquidity, time, price delivery) into a single coherent analytical picture. It is not a signal service. It anticipates directional price delivery through the relationship between structure, liquidity, and time. Its forecasts identify specific price objectives, while developing price action governs execution and invalidation.

The framework itself is built on ten dimensions. What follows gives an idea of what it entails. Below are the analytical components used to teach and apply the framework — useful categories for instruction, not the dimensions themselves.

Tesseract official logo

One view, many dimensions

Like its namesake, the framework folds multiple analytical dimensions — timeframe, liquidity, structure, time — into a single navigable view of market conditions.

Analytical components — the teaching curriculum
Every analysis begins above the trading timeframe. Higher-timeframe bias, dealing ranges, and premium/discount price levels establish where price is permitted to be interesting — and where it is not. No lower-timeframe setup is evaluated outside this context.
Identify resting liquidity: equal highs and lows, prior session extremes, untapped stops. The framework treats liquidity as the market's fuel — engineered purges (stop hunts) are mapped before they occur, not rationalized after.
Define the dealing range — the boundaries within which price is negotiating value. Track shifts in structure that signal a change in the controlling timeframe's intent, read within fractal price behavior across timeframes — lower-timeframe movement is information at its own scale, not noise.
Correlated instruments (e.g., NQ and ES) are read together. SMT divergence — when one makes a new extreme the other fails to confirm — is treated as information about relative strength and impending rotation, organized alongside the primary chart.
PD Arrays identify specific premium and discount price levels where price may return to rebalance.
When matters as much as where. Session opens, killzones, and institutional time windows are layered into the framework so that scenarios carry a temporal condition — a setup outside its time window is a setup declined.
Before any entry is considered, the invalidation level is defined — the price that proves the read wrong. Position sizing flows from the distance to invalidation and the risk manager's allowance, never from conviction.
Execution is governed by a predefined model: conditions for entry, invalidation, intended objective, and management rules. The trader selects and applies the model within the framework the analyst established. Execution is binary — conditions met, or conditions not met. There is no third option.
The Ten Dimensions of Tesseract. Each dimension provides a distinct analytical perspective. Together, they form a coherent framework for interpreting market conditions, evaluating opportunities, and guiding disciplined execution.
Tesseract Overlays. The founder develops TradingView overlays that organize market information — liquidity levels, arrays, session markers — into the Tesseract view. They structure and display information relevant to analysis. They are not predictive signals, and they are never presented as such.
The Frameworks in Application

Weekly Profile — November 1–6, 2026

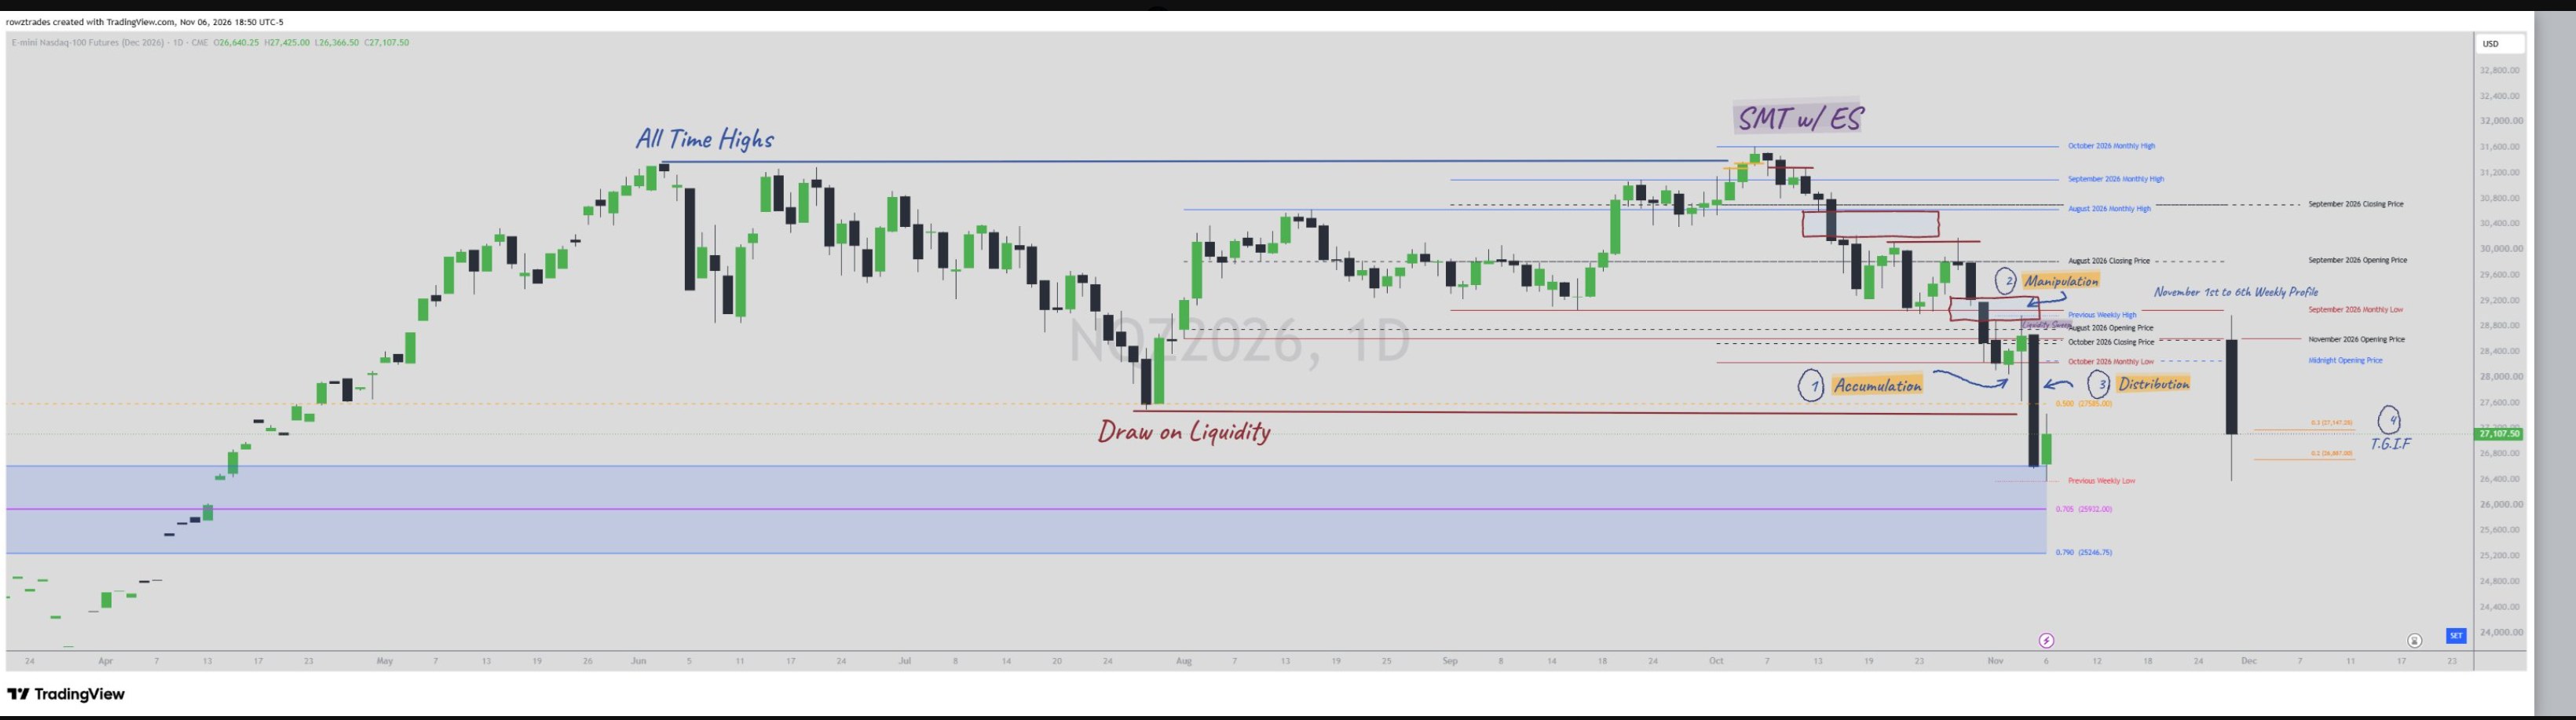
The frameworks applied to one week of Nasdaq futures: all-time highs, SMT with ES, draw on liquidity, and the Accumulation–Manipulation–Distribution sequence.

Weekly Profile, November 1–6, 2026: E-mini Nasdaq-100 futures daily chart annotated with all-time highs, SMT with ES, draw on liquidity, and the Accumulation–Manipulation–Distribution sequence
E-mini Nasdaq-100 futures, daily — November 1–6, 2026. Annotated with the frameworks' references. Chart created November 6, 2026; posted as “Weekly Profile” on November 7, 2026. Tap to enlarge.

Intraday Delivery — November 10, 2026

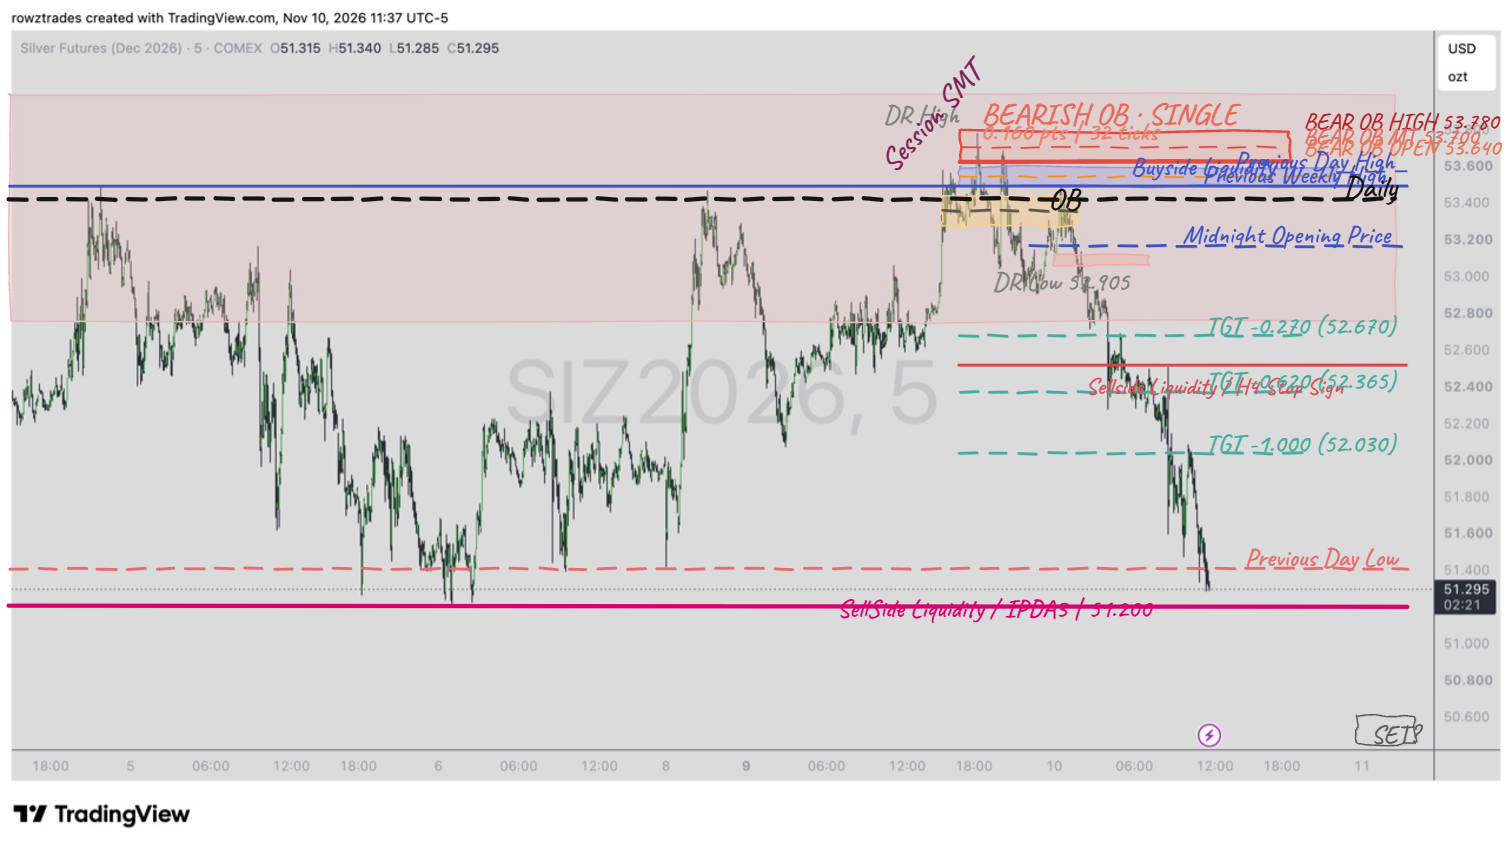
Intraday Delivery, November 10, 2026 — SIZ2026 silver futures (December 2026), 5-minute chart annotated with premium dealing range, Bearish OB at the high, Session SMT, dealing range high and low, and downside targets to the sellside liquidity pool at 51.200
SIZ2026 · Silver futures (December 2026), 5-minute — premium dealing range with the Bearish OB at the high, Session SMT, DR High and DR Low, and downside targets to the sellside liquidity pool at 51.200. Tap to enlarge.

BULLSEYE! 🎯

November 12th, 2026 – November 13th, 2026

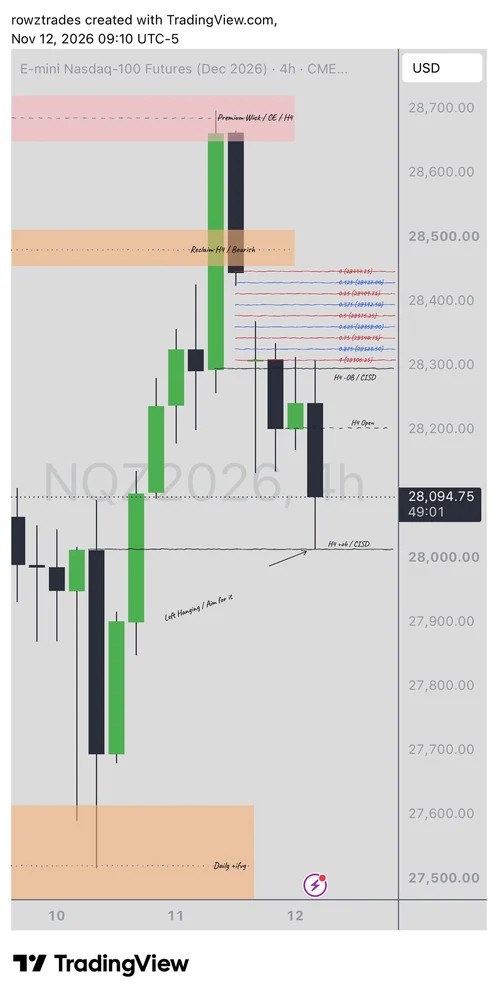
E-mini Nasdaq-100 futures (December 2026), 4-hour chart, November 12, 2026: Premium Wick and Reclaim bands overhead, the H4 +ob at the prior low annotated Left Hanging / Aim for it, Daily +ifvg below
E-mini Nasdaq-100 futures (December 2026), 4-hour — November 12, 2026: the read a day ahead. Premium and the Reclaim overhead; the H4 +ob at the prior low annotated “Left Hanging / Aim for it”; the Daily +ifvg below. Tap to enlarge.
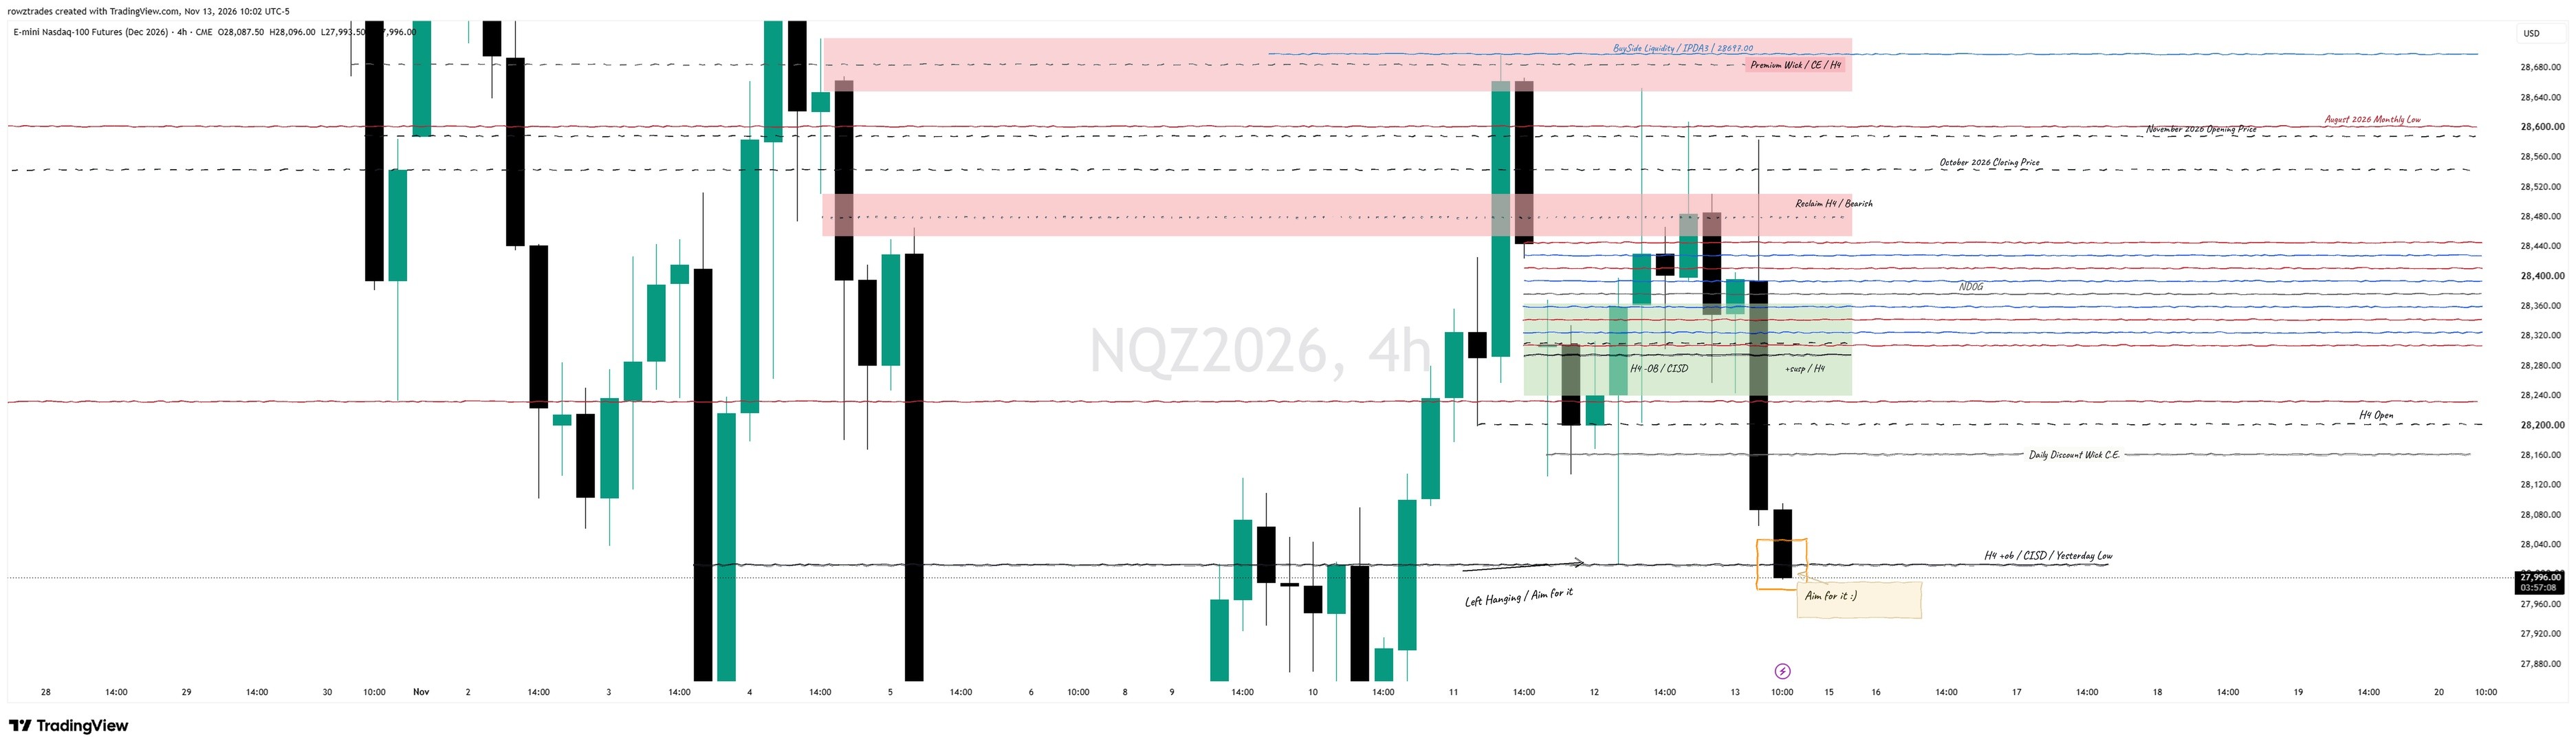
E-mini Nasdaq-100 futures (December 2026), 4-hour chart, November 13, 2026: price delivered down through the dealing range to the H4 +ob / Yesterday Low, annotated Aim for it
E-mini Nasdaq-100 futures (December 2026), 4-hour — November 13, 2026: delivery to the level marked the day before — the H4 +ob / Yesterday Low, “Aim for it :)”. Tap to enlarge.
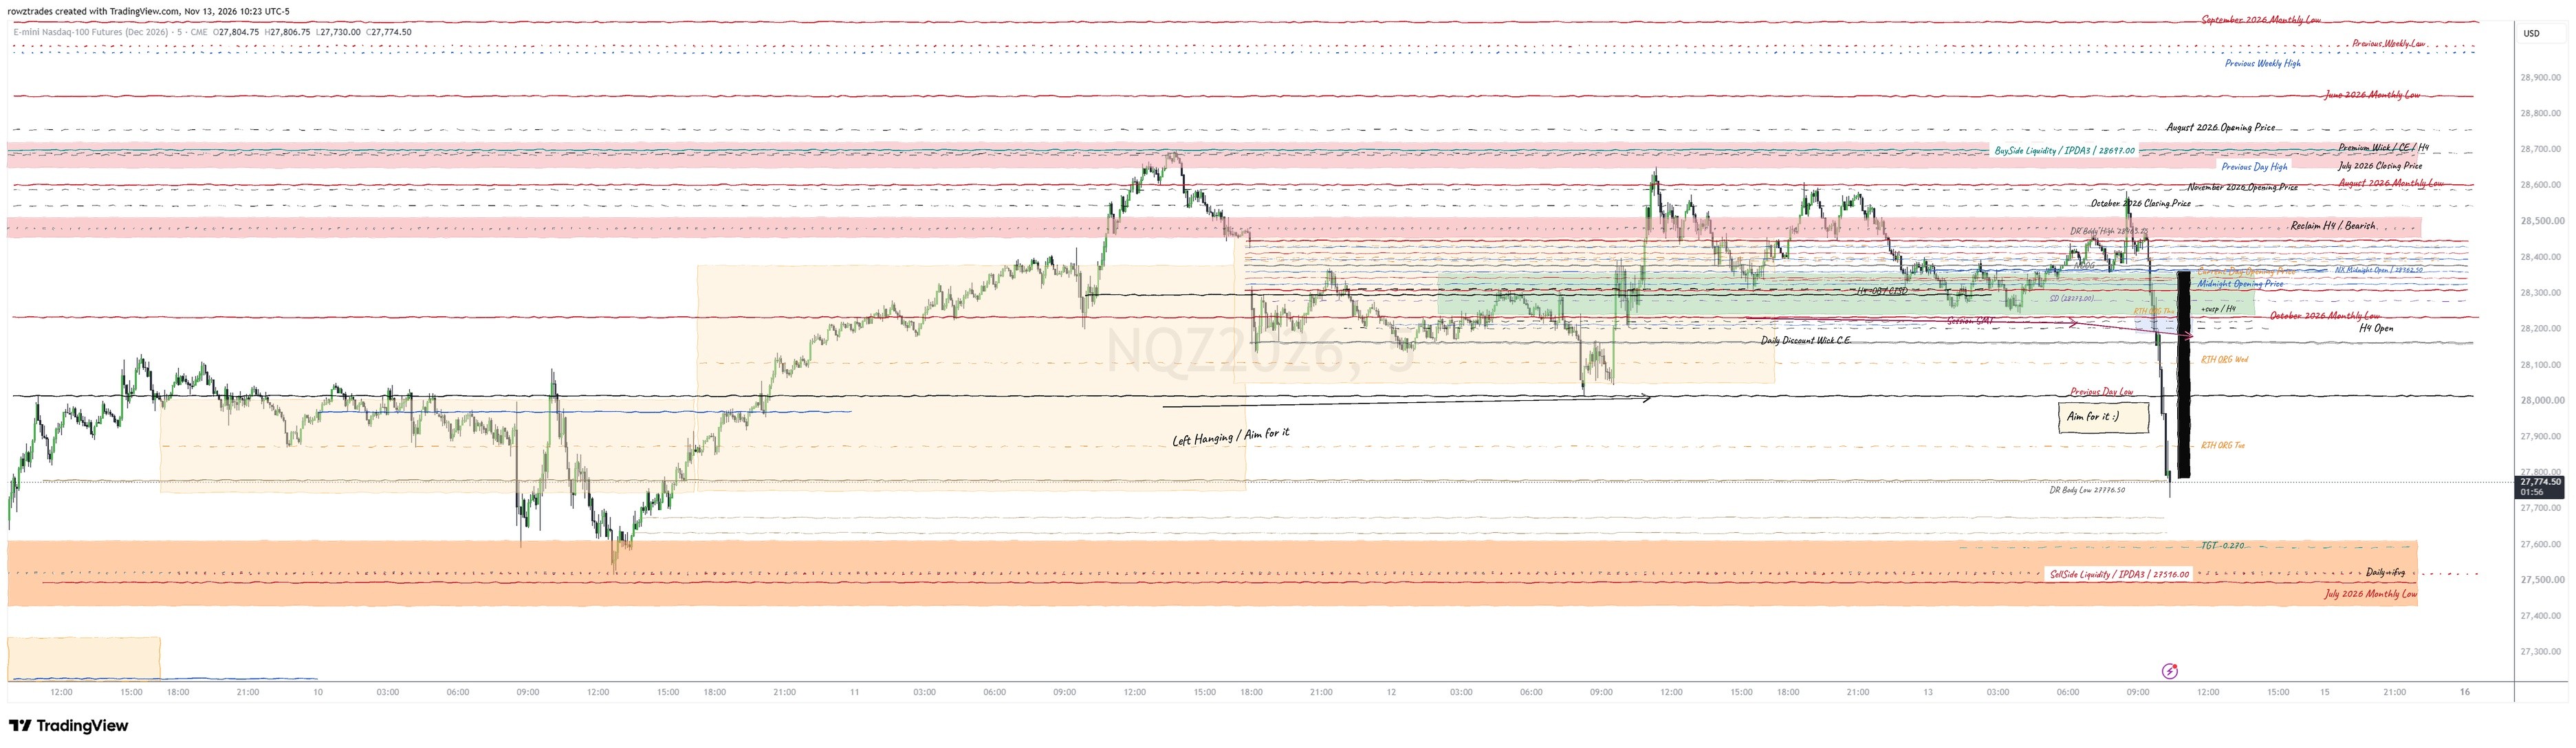
E-mini Nasdaq-100 futures (December 2026), 5-minute chart, November 13, 2026: the intraday delivery through the morning flush to DR Body Low 27776.50, toward SellSide Liquidity / IPDA3 at 27516.00
E-mini Nasdaq-100 futures (December 2026), 5-minute — November 13, 2026: the intraday delivery — the morning flush to DR Body Low 27776.50, with SellSide Liquidity / IPDA3 at 27516.00 and the Daily +ifvg below. Tap to enlarge.
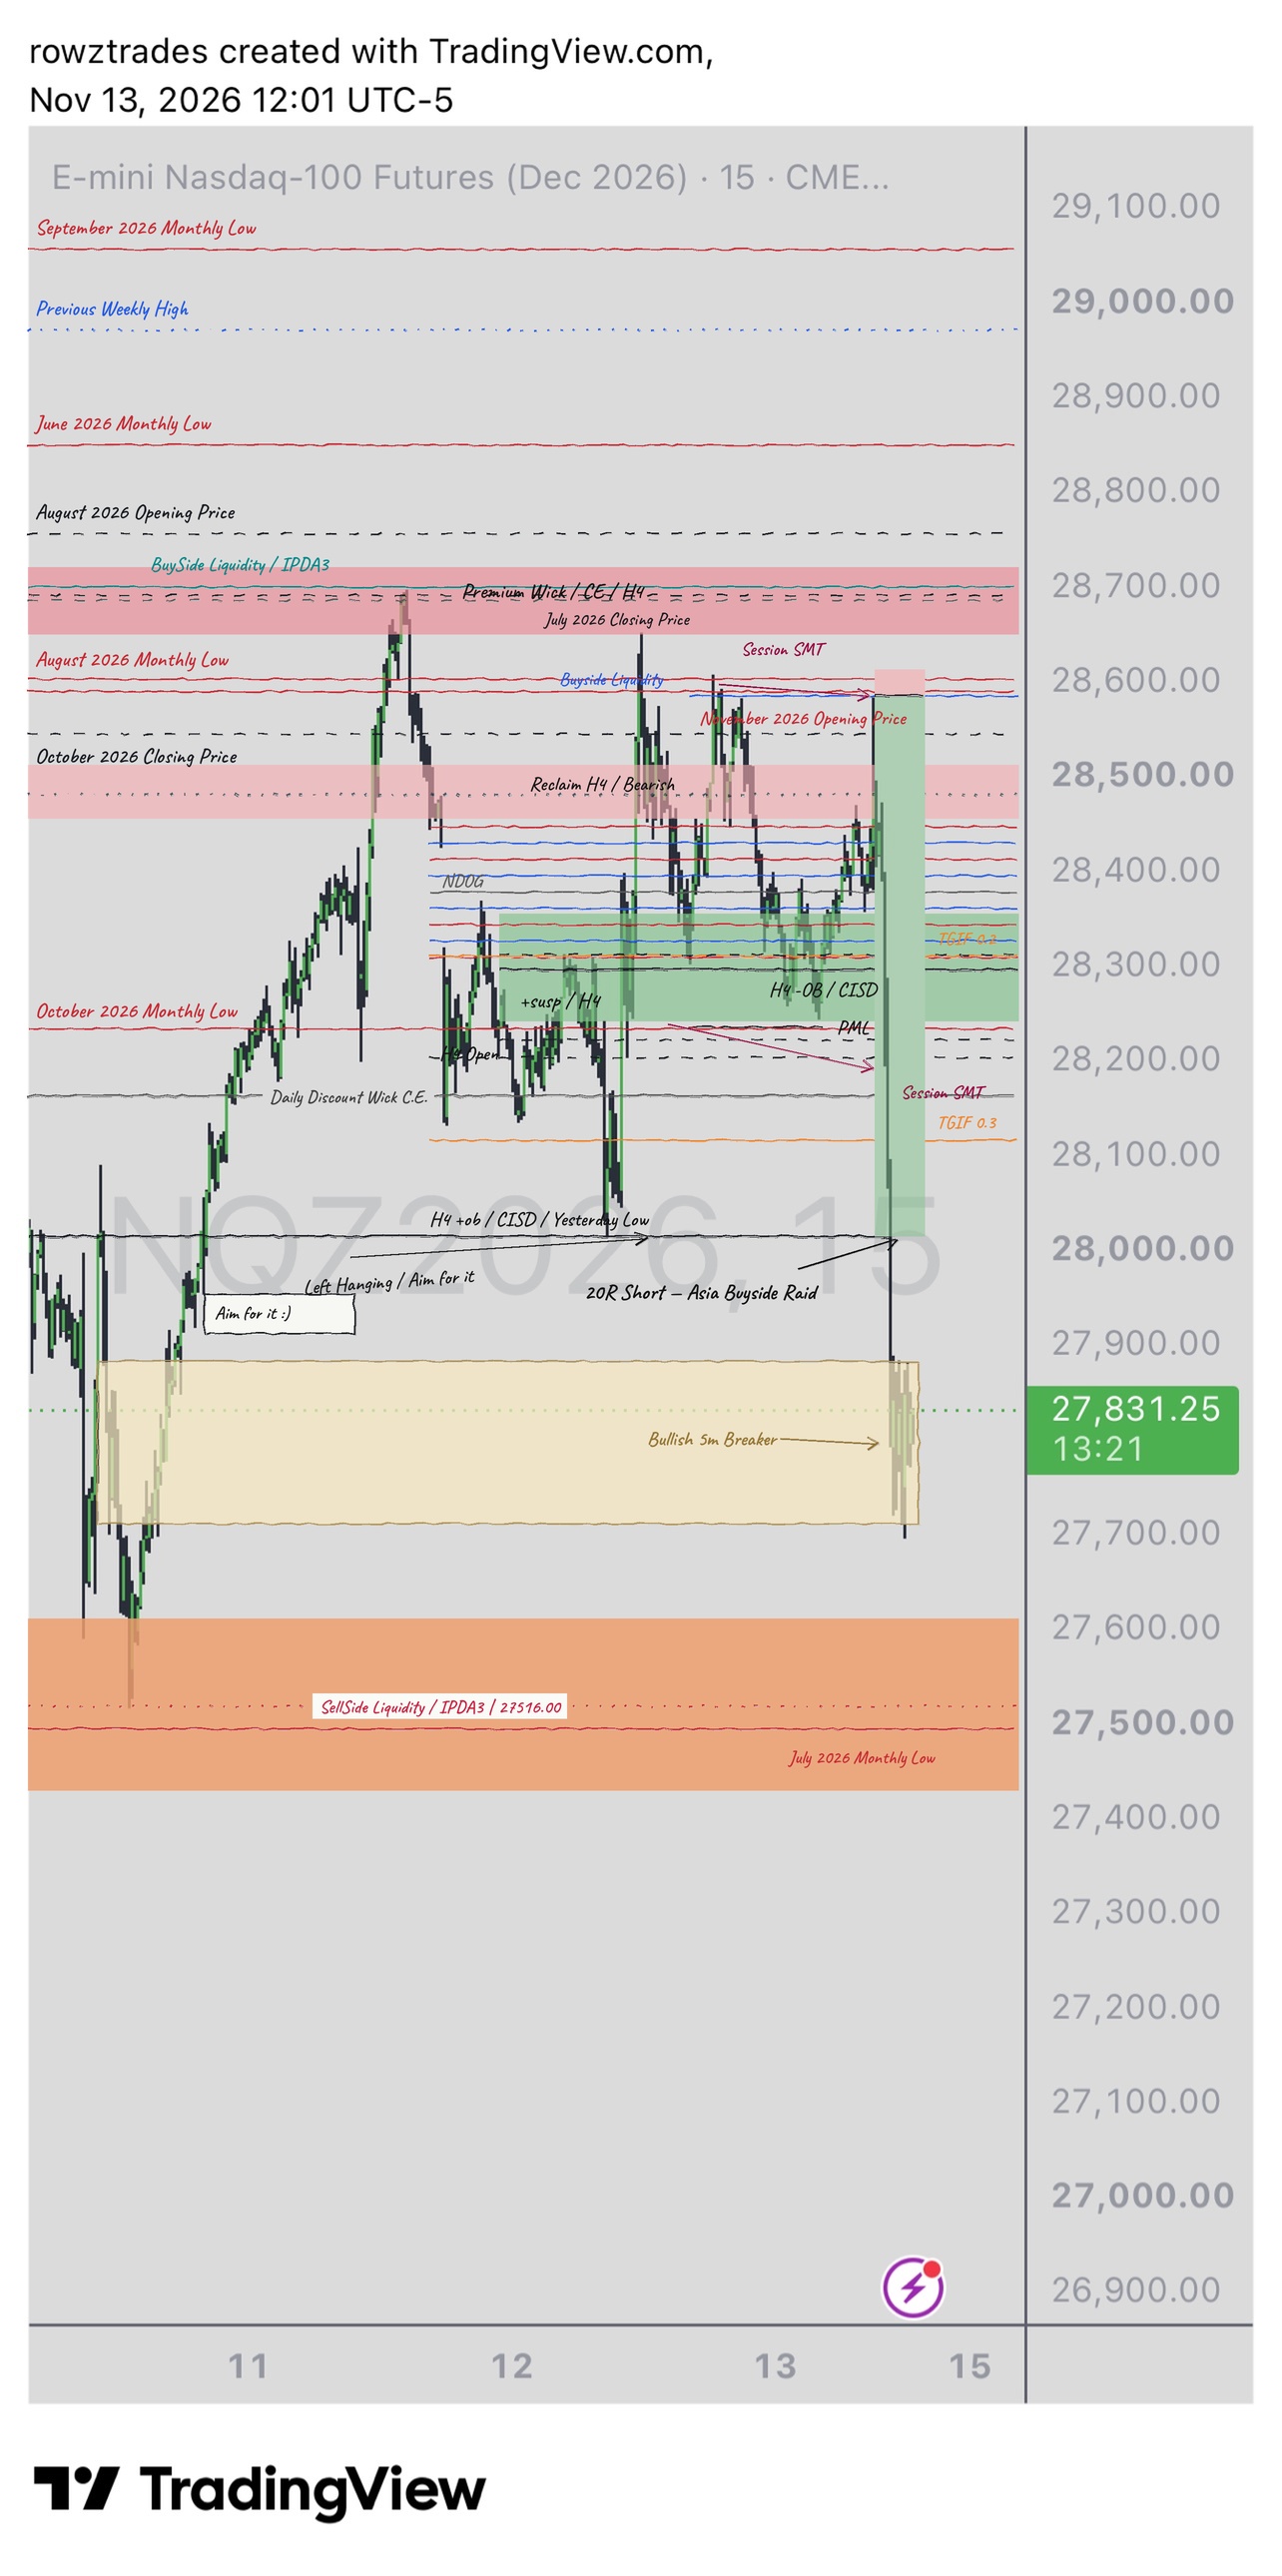
E-mini Nasdaq-100 futures (December 2026), 15-minute chart, November 13, 2026: the day framed in full — the 20R short from the Asia-session buyside raid at 28582.25, delivered to the H4 +ob at 28011.75 and the Daily consequent encroachment, the range stalling at the bullish five-minute breaker, Daily +ifvg below
E-mini Nasdaq-100 futures (December 2026), 15-minute — November 13, 2026: the day framed in full. The 20R short from the Asia-session buyside raid, delivered to the H4 +ob and the Daily consequent encroachment; the range stalling at the bullish five-minute breaker. Tap to enlarge.
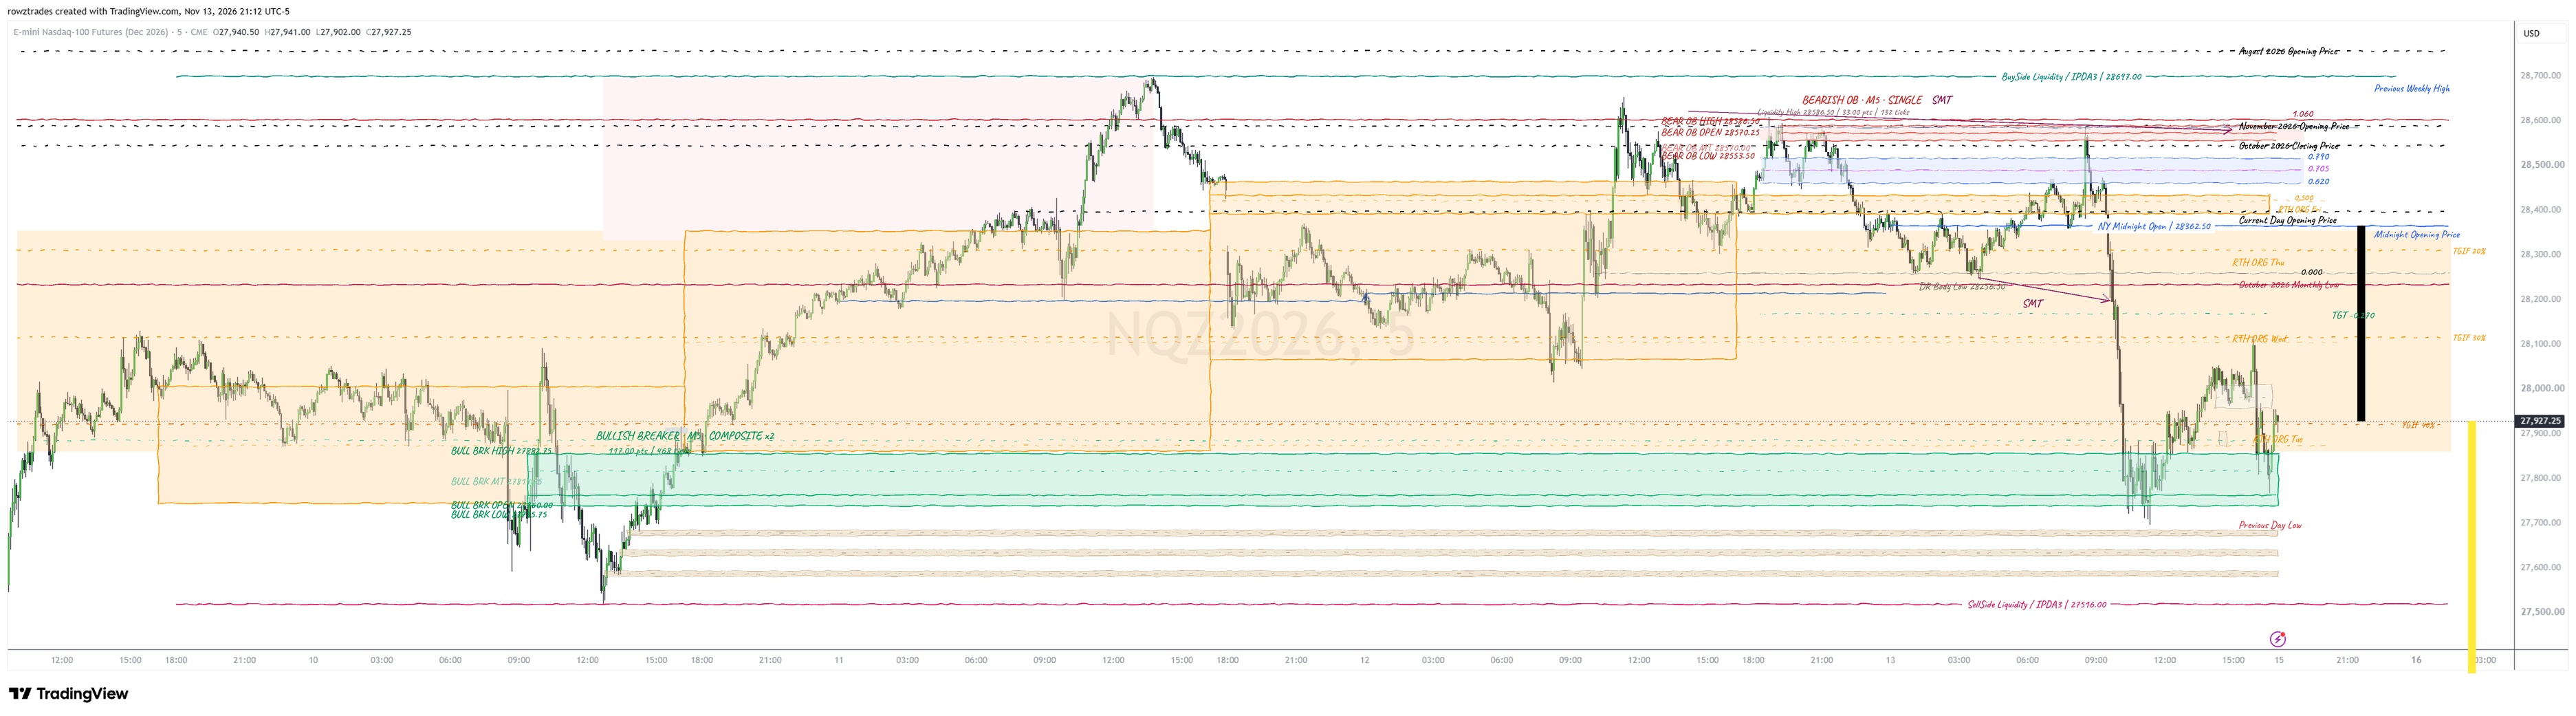
E-mini Nasdaq-100 futures (December 2026), 5-minute chart, the full week to November 13, 2026: the week framed through each day's open, high, low and close — daily dealing ranges and opening-range references, buyside at 28697.00, the bearish M5 order block at the high, delivery to the composite bullish breaker, sell-side liquidity at 27516.00 untouched below
E-mini Nasdaq-100 futures (December 2026), 5-minute — November 13, 2026: the week framed through the daily open, high, low and close. Daily dealing ranges and opening-range references (Tue / Wed / Thu); the buyside at 28,697.00 and the bearish M5 order block at the high; delivery to the composite bullish breaker above the Previous Day Low — and the sell-side draw at 27,516.00 still untouched. Tap to enlarge.