
Bullseye
Delivery to a pre-mapped objective — identified and annotated a day ahead
Nasdaq Futures · November 12–13, 2026
ARETÉ Research No. 003
The Research Question
How much of Friday’s sell-side expansion was identified before the session began — mapped in the prior session’s analysis, at a level annotated a day ahead?
Section 1
Market Context
The case spans three sessions of one continuous map.
On Wednesday, November 11, 2026, Nasdaq futures established the weekly high inside a premium structure on the 4-hour chart: the Premium Wick band at 28,647.00 – 28,718.00, its consequent encroachment at 28,683.00, and the BuySide Liquidity / IPDA3 reference at 28,697.00. The high was set in premium, above the overhead references the map carried — the August 2026 Monthly Low at 28,600.00, the November 2026 Opening Price at 28,587.00, and the October 2026 Closing Price at 28,542.00.
Beneath price, the map was layered. The Reclaim H4 / Bearish band stood at 28,453.00 – 28,509.00 (consequent encroachment 28,478.00). Below it, a dealing-range framework — NDOG at 28,375.25, the H4 −OB / CISD line at 28,293.25 within the +susp / H4 band at 28,239.00 – 28,362.00, and the H4 Open at 28,200.50 — led to the Daily Discount Wick C.E. at 28,160.00.
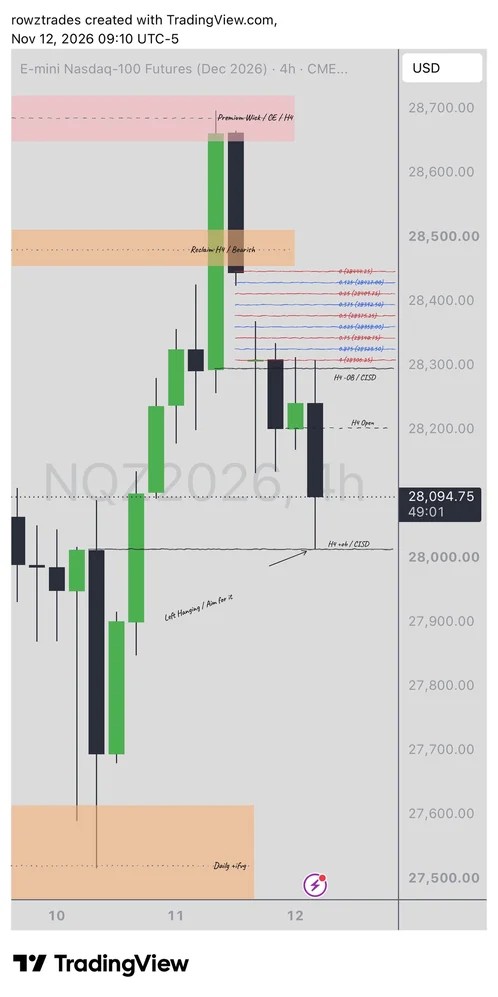
The map’s downside objective sat below all of it: the H4 +ob / CISD at 28,011.75, annotated on the November 12 chart “Left Hanging / Aim for it.” The annotation and the level are present in the November 12 record — a full session before the delivery this publication examines.
On Thursday, November 12, the delivery had begun but not completed. The analyst’s 09:10 chart shows the session’s rotation already underway — the forming 4-hour candle had printed a low of 28,058.25, through the Daily Discount Wick C.E. at 28,160.00 — yet the objective at 28,011.75 remained unmet, 46.50 handles below that low, with price at 28,094.75. The map remained in force. Nothing in the November 12 record revises the objective; the session closed with the draw on the H4 +ob probed and still outstanding.
Section 2
Analytical Framework
The framework that governed Friday’s session was assembled before it, and each of its elements is documented in the archived charts.
The pre-mapped objective
The H4 +ob / CISD at 28,011.75 — also the prior day low reference on Friday’s charts — was identified on November 12 as the downside destination and annotated accordingly. It was not selected during Friday’s movement. The distance from the weekly high reference (28,697.00) to the objective was 685.25 handles.
The objective was not selected during Friday’s movement.
Layered structural references
Between premium and the objective, the map carried the successive references listed in Section 1: the Reclaim band, NDOG, the H4 −OB / CISD and +susp band, the H4 Open, and the Daily Discount Wick C.E. These are specific price levels and PD Arrays — the route markers against which Friday’s delivery can be audited level by level.
The deeper draw
Below the objective, the map carried a further sell-side reference: SellSide Liquidity / IPDA3 at 27,516.00, inside the Daily +ifvg (27,427.00 – 27,608.00), with the July 2026 Monthly Low adjacent. This was the next layer of the draw if the primary objective completed — a standing reference, not a forecast that Friday would reach it.
Session structure and the catalyst
Friday, November 13 carried a scheduled catalyst: the Bureau of Labor Statistics released the October 2026 Producer Price Index at 08:30 ET. Within the analyst’s session framework — the Asia session (20:00–00:00 ET) and the CBDR session (16:00–20:00 ET) preceding it — the session’s opening movement ran upward into the Asia-session buyside before the bearish repricing. Session SMT between ES and NQ is annotated on the November 13 5-minute and 15-minute charts. The analyst’s session account additionally identifies an ES 15-minute bullish FVG inversion as the execution confirmation; that element rests on the analyst’s account and is not independently chart-verified in the archive (see Research Notes).
The marked trade idea
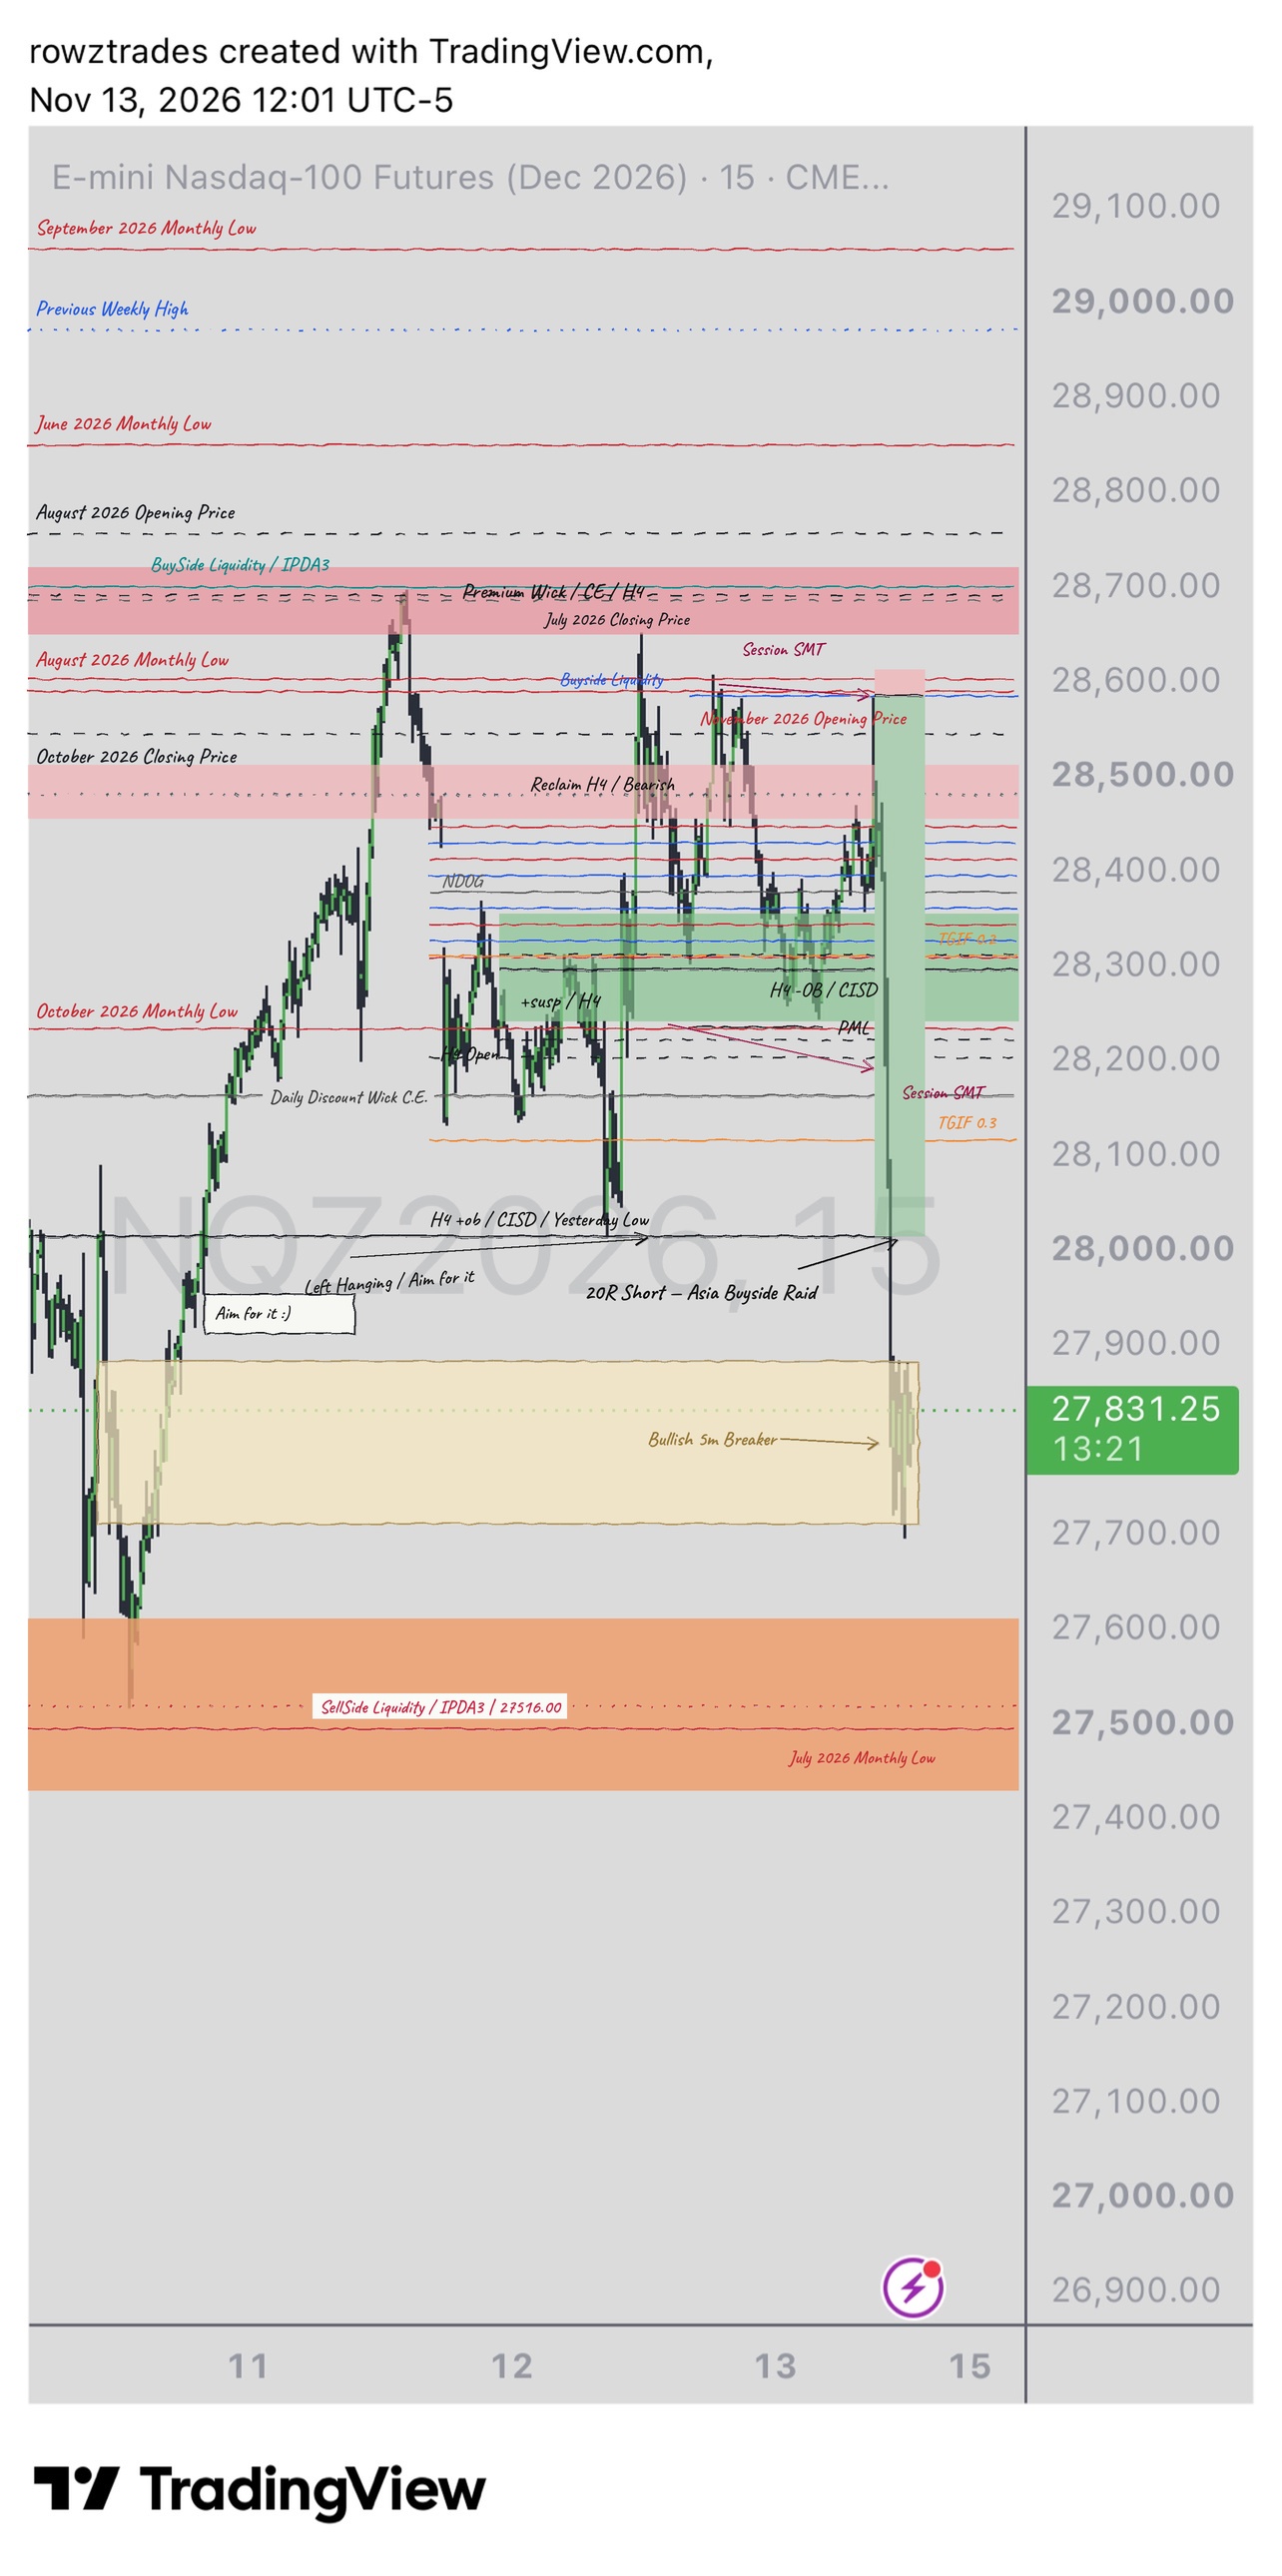
The final 15-minute chart carries a marked short framed on the Asia buyside raid: entry reference 28,582.25, stop 28,610.00 (27.75 handles of risk), target 28,011.50 — the pre-mapped H4 +ob — for 570.75 handles, a 20.57R marked geometry, labeled “20R Short — Asia Buyside Raid.” The label describes a marked trade idea and its measured geometry. It is not an execution record, and no realized performance is claimed for it anywhere in this publication.
Friday references
The 15-minute chart also carries TGIF references (0.2 / 0.3) — the framework’s Friday expectation that price closes within 20–30% of the weekly range — framing the delivery’s late-session stall (Section 4).
Section 3
Liquidity Objectives
Measured from the weekly high reference at 28,697.00:
| Structural reference | Level | Distance below 28,697.00 | Classification |
|---|---|---|---|
| Daily Discount Wick C.E. | 28,160.00 | 537.00 handles | Pre-mapped reference — first traded through Nov 12; delivered through Nov 13 |
| H4 +ob / CISD / Yesterday Low (“Left Hanging / Aim for it”) | 28,011.75 | 685.25 handles | Pre-mapped objective (Nov 12) — reached Nov 13 |
| Bullish 5-minute breaker | 27,708.00 – 27,880.00 | 817.00 – 989.00 handles | Reached Nov 13 — delivery stalled there |
| Session low, November 13 (5-minute) | 27,730.00 | 967.00 handles | Observed extent of the delivery |
| SellSide Liquidity / IPDA3 (in Daily +ifvg) | 27,516.00 | 1,181.00 handles | Pre-mapped deeper draw — not reached Nov 13 |
The Daily Discount Wick C.E., the primary objective, and the deeper draw were identified before Friday’s session — the primary objective a full session before. The breaker and the session low are Friday observations. These figures measure the mapped price range and the observed delivery; they are not claimed trade profits or captured points.
Section 4
Observed Price Delivery
Before the session. The November 12 charts (09:10 and the day’s 4-hour set) document the complete map — premium structure, layered references, and the annotated objective at 28,011.75 — with the delivery already underway: Thursday’s rotation had carried price through the Daily Discount Wick C.E. to a 28,058.25 low, stopping 46.50 handles short of the objective, which remained outstanding into Friday.
Friday’s opening movement. Following the 08:30 ET PPI release, the session’s initial movement ran upward: price raided the Asia-session buyside, reaching the 28,610.00 area that the marked short’s stop reference caps. The 09:34 4-hour chart shows the session’s opening structure with the full HTF ladder in place.
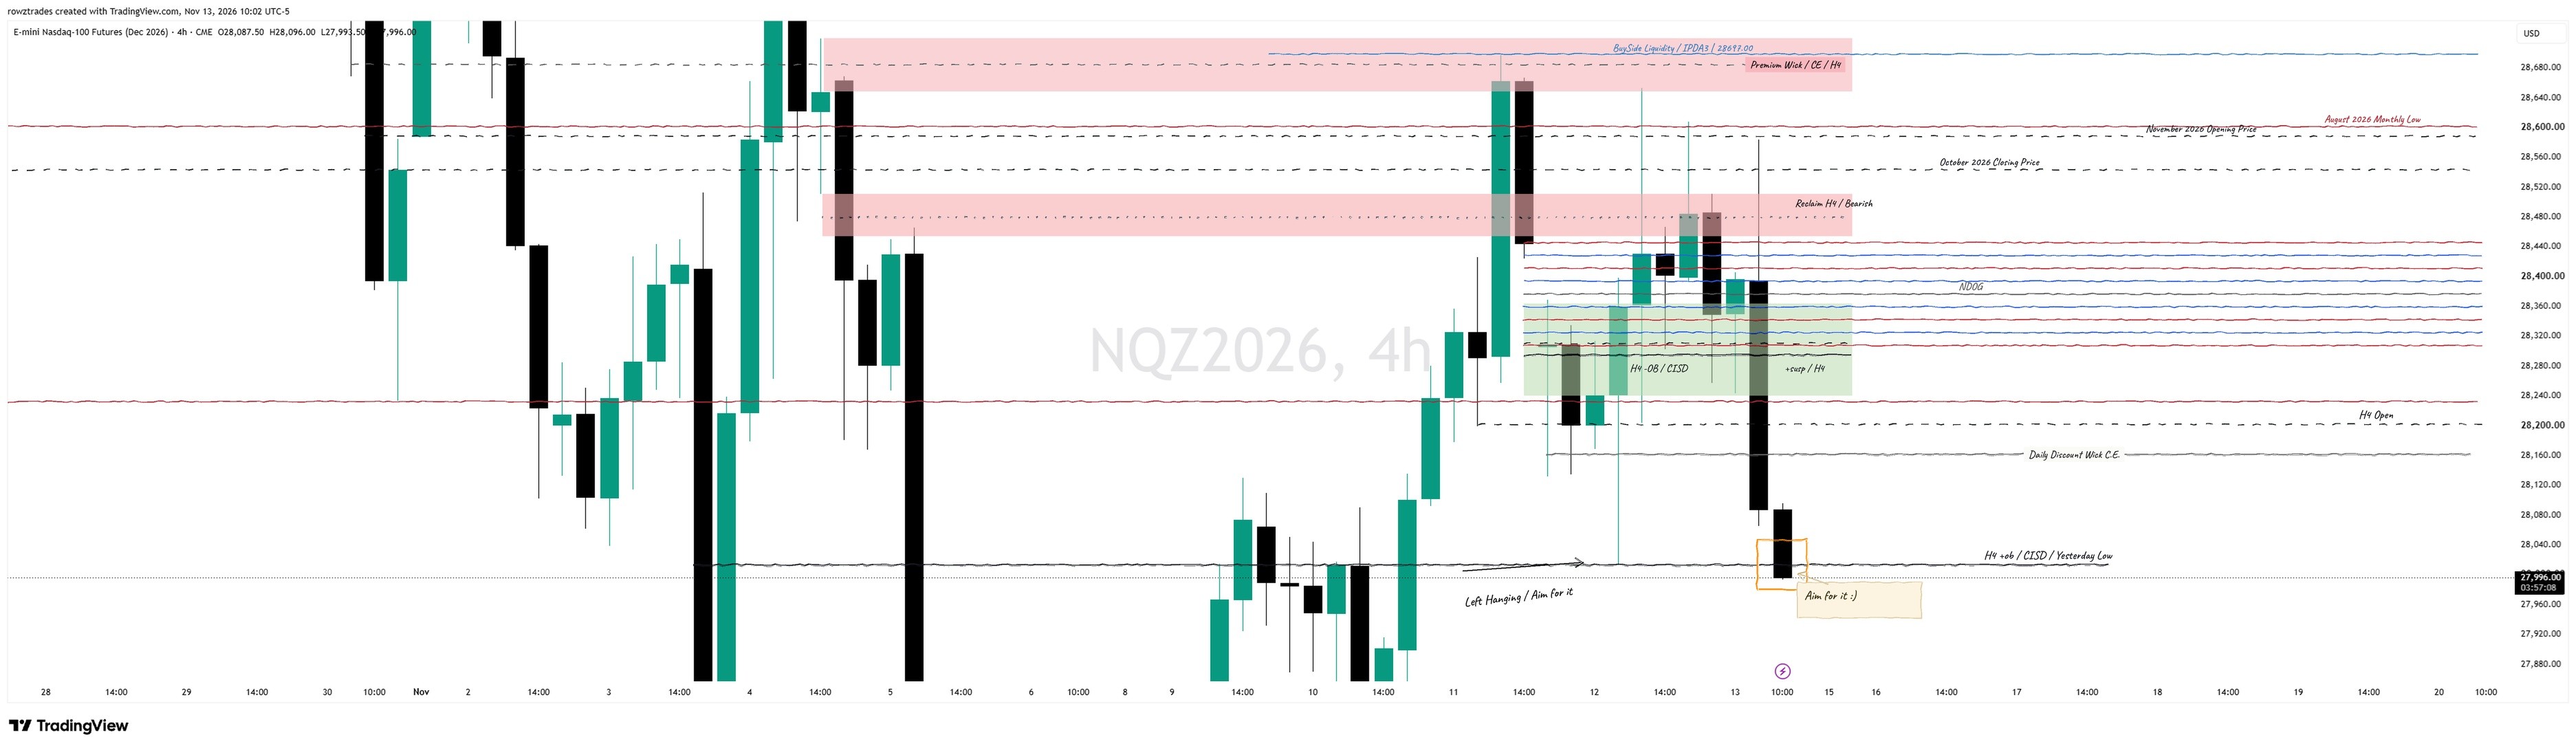
The repricing. Price then repriced bearishly through the mapped ladder. The 09:50 displacement on the 5-minute chart carried price through the +susp / H4 band and the intraday references in a single expansion. By the 10:02 4-hour chart, price printed 27,996.00 — through the Daily Discount Wick C.E. at 28,160.00 and into the H4 +ob at 28,011.75. The objective annotated on November 12 was reached, at the level annotated, in the session that followed.
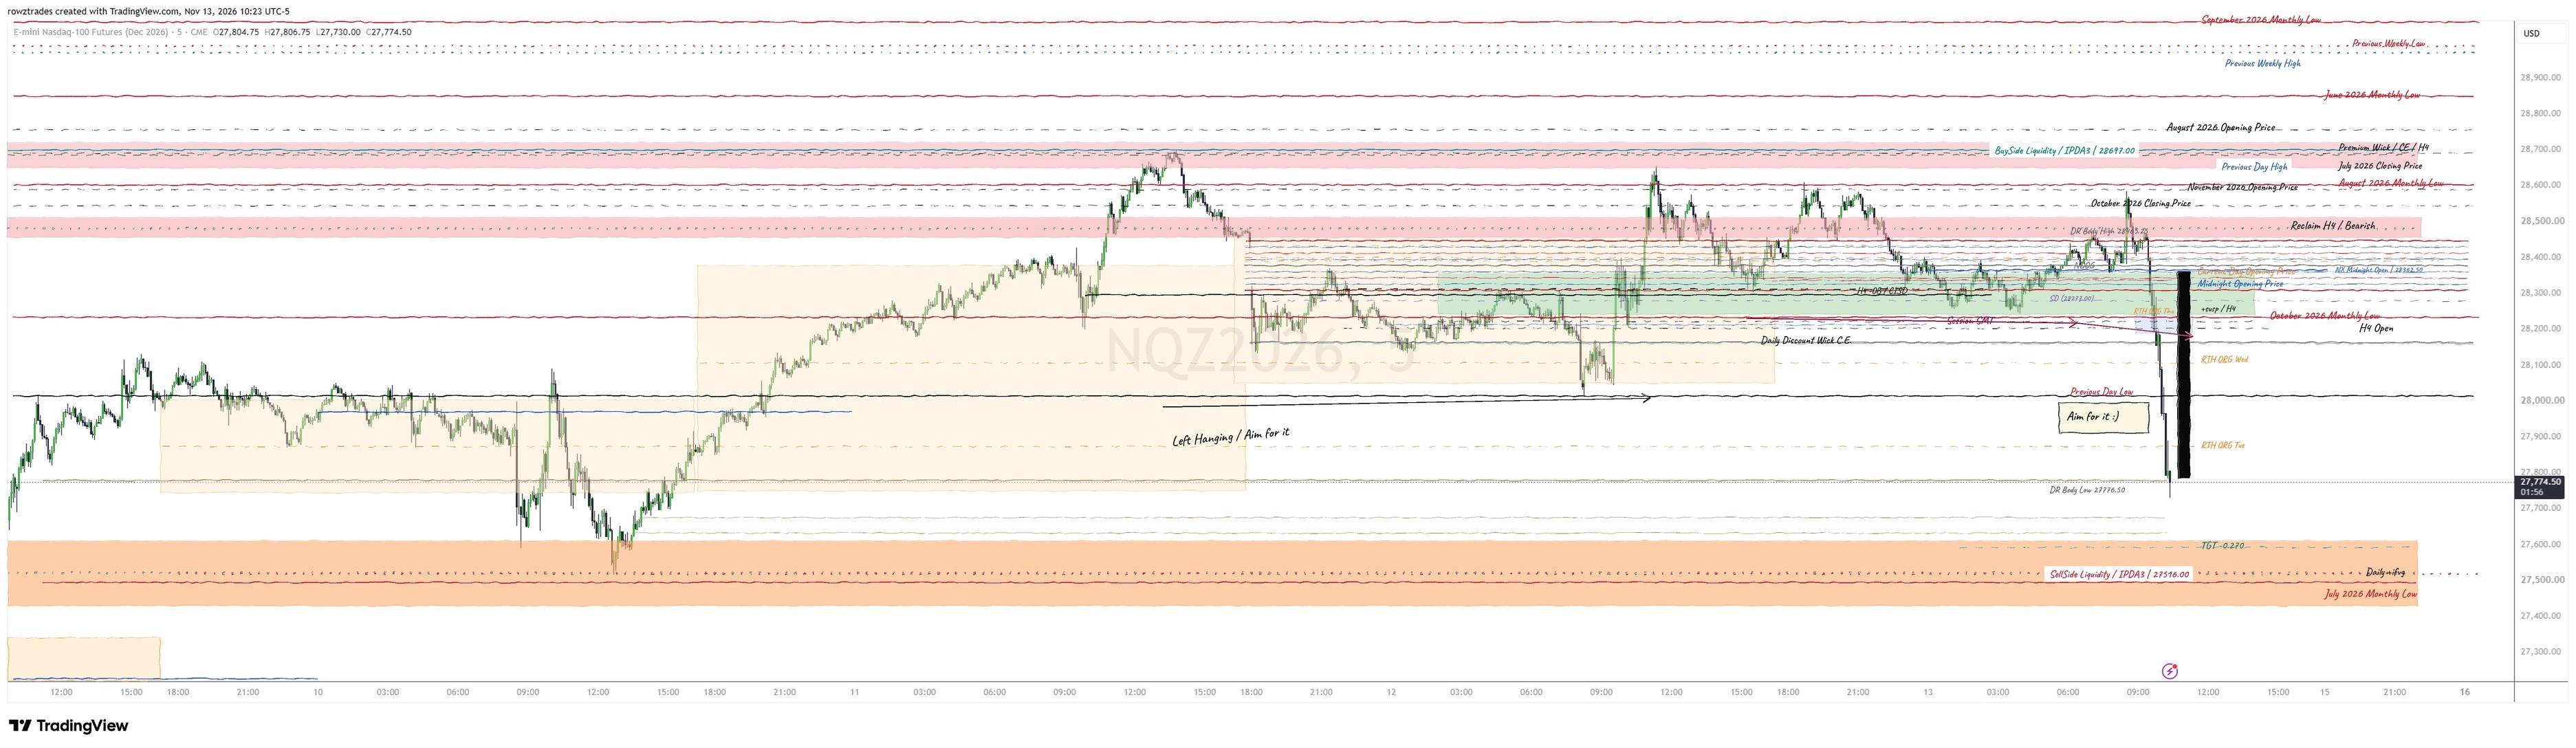
The extension and the stall. The delivery extended below the objective to a 27,730.00 low (5-minute, 10:23) — through the DR Body Low at 27,776.50 — and stalled at the bullish 5-minute breaker (27,708.00 – 27,880.00). The final 15-minute frame (~12:01) shows the full day: the Asia buyside raid at the high, the marked 20R geometry drawn to the H4 +ob, delivery through the Daily consequent encroachment, and the range stalling at the breaker, with the TGIF references annotated at the delivery’s lower reach.
What did not occur. Price did not reach the deeper sell-side draw at 27,516.00. That reference remains outstanding beyond this case, as does any statement about the sessions that followed.
Section 5
Analytical Implications
The significance of this case is continuity. The destination was not identified during Friday’s expansion; it was identified on Thursday, annotated in plain language — “Left Hanging / Aim for it” — and the following session delivered to it through every intermediate reference the map had layered in between. The weekly high in premium set the context on Wednesday; Thursday’s probe stopped 46.50 handles short of the objective and did not revise the map; Friday’s catalyst session supplied the raid, the intermarket confirmation, and the displacement. The Analyst’s map survived contact with two sessions unchanged, and price audited it level by level.
The marked trade idea illustrates the separation of functions. The Analyst maintained the destination across three sessions. The execution framing — a short marked at the Asia buyside raid, its stop placed above the raid, its target set at the objective identified a day earlier — was constructed so that the trade idea’s entire geometry derived from the map: 27.75 handles of defined risk against 570.75 handles to the pre-mapped level. Whether and how such an idea is executed belongs to a different record than this one; this publication documents the analysis and the delivery, and makes no execution or performance claim.
ANALYST LEADS. TRADER OBEYS. RISK MANAGER DECIDES.
One documented case cannot establish that this accuracy is repeatable across market conditions. What this case establishes is narrower and verifiable: a downside objective of 685.25 handles was identified and annotated a full session before the delivery; the delivery reached it through the mapped references in sequence; and the preserved chart record — timestamps, levels, and annotations — allows any reader to audit that sequence against the claims made here.
Research Notes
Method & boundaries
- Sources: timestamped TradingView charts, November 12 (09:10 ET and the 4-hour set) and November 13 (09:34, 10:02, 10:20–10:23, ~12:01 ET), Nasdaq futures (December 2026). All price levels in this publication were measured from the archived charts’ own annotation geometry; approximations in earlier external drafts of this case were replaced with the measured figures.
- Timing: the objective at 28,011.75 and its annotation are documented on November 12, before the objective was reached; Thursday’s session probed to within 46.50 handles of it. The completion is documented on the November 13 charts. The deeper draw at 27,516.00 was not reached and is reported as outstanding.
- The catalyst reference is a calendar fact: the October 2026 PPI was released by the Bureau of Labor Statistics at 08:30 ET on Friday, November 13, 2026. The publication describes the session sequence as observed on the charts; it does not attribute price movement to the release beyond its position as the session’s scheduled catalyst.
- Session SMT is annotated on the November 13 5-minute and 15-minute charts. The ES 15-minute bullish FVG inversion is part of the analyst’s session account; no archived chart in this case isolates it, and it is identified here as account-based rather than chart-verified.
- The “20R Short — Asia Buyside Raid” label and its figures (entry reference 28,582.25; stop 28,610.00; target 28,011.50; 20.57R) describe a marked trade idea drawn on the chart. No execution records are archived for this case, and none are claimed.
- No profit figures are included. Handles = Nasdaq points.
- Chart annotations are preserved as-is; the publication refers to price delivery arrays generically as PD Arrays and cites PD Arrays as specific price levels.
- Detailed evidence-verification records, including the claim-by-claim review of the external draft that originated this case, are retained in the internal research archive.