
The Downrange Projection
The scale of intraday price delivery, identified before the movement unfolded
Nasdaq Futures · October 16, 2026
ARETÉ Research No. 002
The Research Question
How much of the subsequent intraday movement could be anticipated through a structured analytical framework before price delivery occurred?
Section 1
Market Context
On October 16, 2026, the analytical framework for Nasdaq-100 futures favored bearish price delivery.
The analysis began with an established dealing range, visibly organized into premium and discount regions. The range provided the framework for interpreting price delivery, evaluating bearish conditions, and identifying objectives.
The range’s high was the prior session’s 15:25 high. That high was significant because it had failed to reach the consequent encroachment at 30,244.75. Price had been unable to reach the CE. The high was therefore a failed retest, not a reclaim — a bearish structural condition within the dealing range.
Importantly, the prior day low at 29,622.50 was outside the established dealing range. This distinction is fundamental. The analytical objective was not simply to identify a nearby sell-side liquidity level. It was to evaluate whether price could deliver through the dealing range and continue toward external liquidity. The dealing range established the context. The liquidity outside that range provided the potential destination.
The 30,184 – 30,212 reference area serves as the measurement baseline for the projection’s scale (Section 3).
Section 2
Analytical Framework
The bearish framework was composed of several interconnected elements, documented before the delivery.
Dealing range and relative position
The established dealing range, organized into premium and discount regions, defined the territory and established price’s relative position within it. The failure of the range high to reach the consequent encroachment at 30,244.75 established that the upper boundary of the range had not been reclaimed.
Intermarket analysis and timing
SMT divergence was identified in conjunction with the Judas swing. The charts also carried annotations identifying Reconnect Premium and other structural references. Reversals were identified at 1 AM (October 16), providing the temporal condition for the bearish delivery. These elements supported the bearish interpretation.
Graded reference area
The 30,184 – 30,212 area was identified and graded within the broader framework as a reference area in the bearish structure. The available evidence does not establish a specific execution trigger at this area, and none is claimed. The area is a measurement reference, not necessarily an executable entry range.
External liquidity and the higher-timeframe PD Array
Yesterday’s price action had already penetrated a Daily PD Array, leaving a remaining portion beyond the prior day low. The Daily Pool of Liquidity was the annotated pool framing that remaining portion. The framework therefore contemplated price moving beyond the established dealing range, reaching external sell-side liquidity, and potentially continuing into the remaining higher-timeframe PD Array.
The drawing convention
When a downside Pool of Liquidity is framed on the chart, its upper boundary establishes the intended objective. A separate numerical annotation is unnecessary because the drawing itself identifies the price level. In this analysis, the upper boundary of the framed Daily Pool corresponded to yesterday’s low at 29,622.50. Framing the pool was itself the act of identifying the objective. The geometry of the drawing is part of the analysis. The prior day low and the Daily Pool remain distinct references — the low is yesterday’s price extreme; the pool is the framed remaining PD Array — but the pool’s upper boundary is positioned at the low, and that positioning is what sets the target.
Framing the pool was itself the act of identifying the objective.
Contemporaneous documentation of the process
In addition to timestamped static charts, a screen recording of the TradingView session (4 minutes 43 seconds, accelerated) documents the framework in development. Around 1 minute 29 seconds of video time, the recording shows the Daily Pool being framed on the Daily chart while the dealing-range framework is visible. The recording shows the analytical process, not merely a completed chart after price delivery. The recording’s displayed chart times are preserved throughout this publication and distinguished from elapsed video time.
Together, these elements formed a coherent analytical framework: the dealing range (premium/discount) provided structural context; SMT and timing supported the bearish interpretation; the graded area provided a measurement reference; and the external liquidity and remaining higher-timeframe PD Array provided the framework for evaluating continued downside delivery — established before price delivery occurred.
Section 3
Liquidity Objectives
The framework identified successive downside references before the delivery.
Initial downside liquidity concentration
The first downside objective was a concentration of sell-side references:
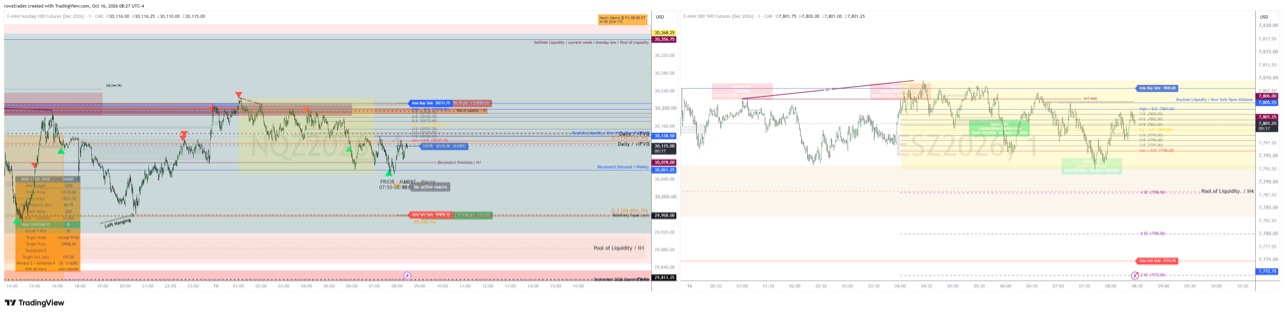
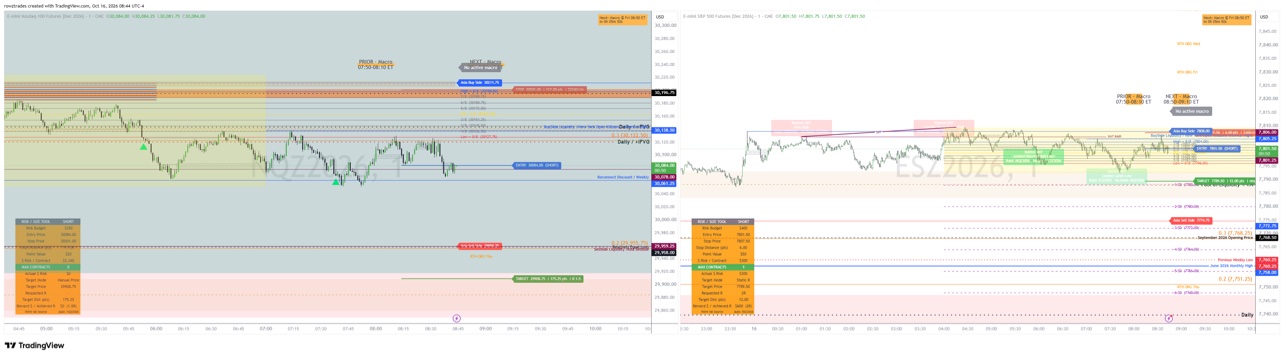
Left Hanging: 29,959.25.
Relatively equal lows: 29,958.
Asia sell-side liquidity.
These were closely associated downside liquidity references — a specific concentration of liquidity identified before the delivery, not a single isolated level. They represented an initial downside concentration within a broader analytical sequence. The more consequential question was whether price would continue beyond that concentration toward external, higher-timeframe liquidity.
Prior day low and the Daily Pool’s upper boundary: 29,622.50
The prior day low is yesterday’s low, situated outside the established dealing range. The Daily Pool of Liquidity framed the remaining portion of the higher-timeframe Daily PD Array beyond that low. The pool’s upper boundary was positioned at the prior day low — 29,622.50 — and that positioning established the downside objective. The upper boundary is the target; the remaining PD Array provides the context for possible continued delivery. The analysis contemplated price moving beyond the dealing range, reaching external sell-side liquidity, arriving at the pool’s upper boundary, and potentially continuing into the remaining PD Array.
Scale of the projection
Measured from the 30,184 – 30,212 reference area:
| Structural reference | Distance from reference area | Classification |
|---|---|---|
| 29,959.25 — Initial sell-side concentration | 224.75 – 252.75 handles | Pre-move documented objective |
| 29,622.50 — Prior day low / Daily Pool upper boundary | 561.50 – 589.50 handles | External objective established by framing the Daily Pool |
| 29,509.25 — Subsequent extension | 674.75 – 702.75 handles | Retrospective observation |
The first two rows were identified before the delivery. The third row is the subsequently observed extension, not part of the pre-move projection. These figures are measurements of the mapped price range.
Section 4
Observed Price Delivery
Pre-move evidence. The 06:27–06:44 charts document the analytical conditions, annotations, and the initial liquidity objective. The Left Hanging annotation, the dealing range, the consequent encroachment reference, the SMT and Judas swing annotations, and the graded area were all documented before the delivery. The Daily Pool framing was documented in the recording (see below); the pool’s upper boundary was positioned at 29,622.50.
Recording timeline (displayed chart times, October 16)
~08:37: The NQ chart shows the 29,959.25 sell-side reference, with an open annotation editor containing “SellSide Liquidity / Asia SellSide.” The editing activity itself is visible.
Video 01:29 — Daily Pool framing: The recording shows the Daily Pool being framed on the Daily chart while the dealing-range framework is visible. This documents the range-based analytical process and the framing that established the downside objective.
09:08–09:33: The recording moves between NQ and ES, showing liquidity references, SMT, macro timing, and the developing bearish movement. The framework remains visible as price develops.
~09:43: NQ trades below 29,959.25, with the marked H1 liquidity region in view. The annotation “Order Filled / No Trade / Didn’t Want to Chase” is visible, establishing the stated decision not to chase. The annotation does not independently establish the details of any subsequent execution, nor does it prove that no subsequent participation occurred.
The recording is accelerated. Displayed chart times are preserved and distinguished from elapsed video time.
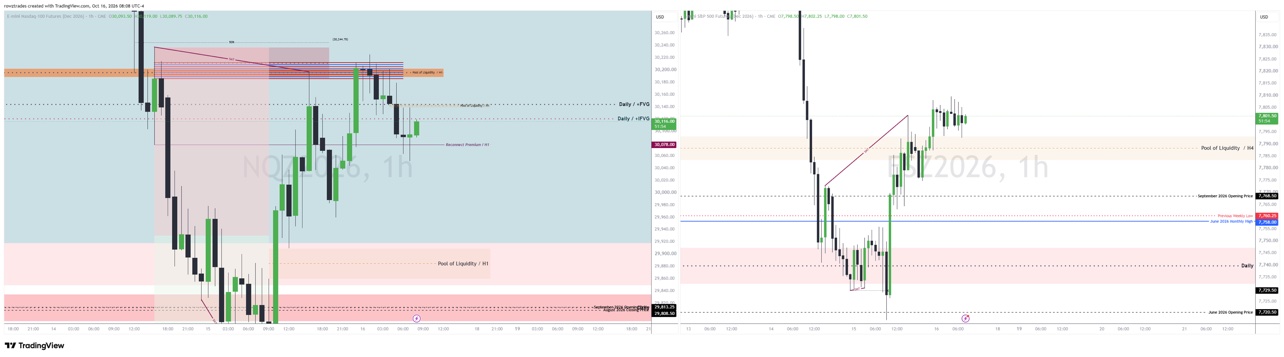
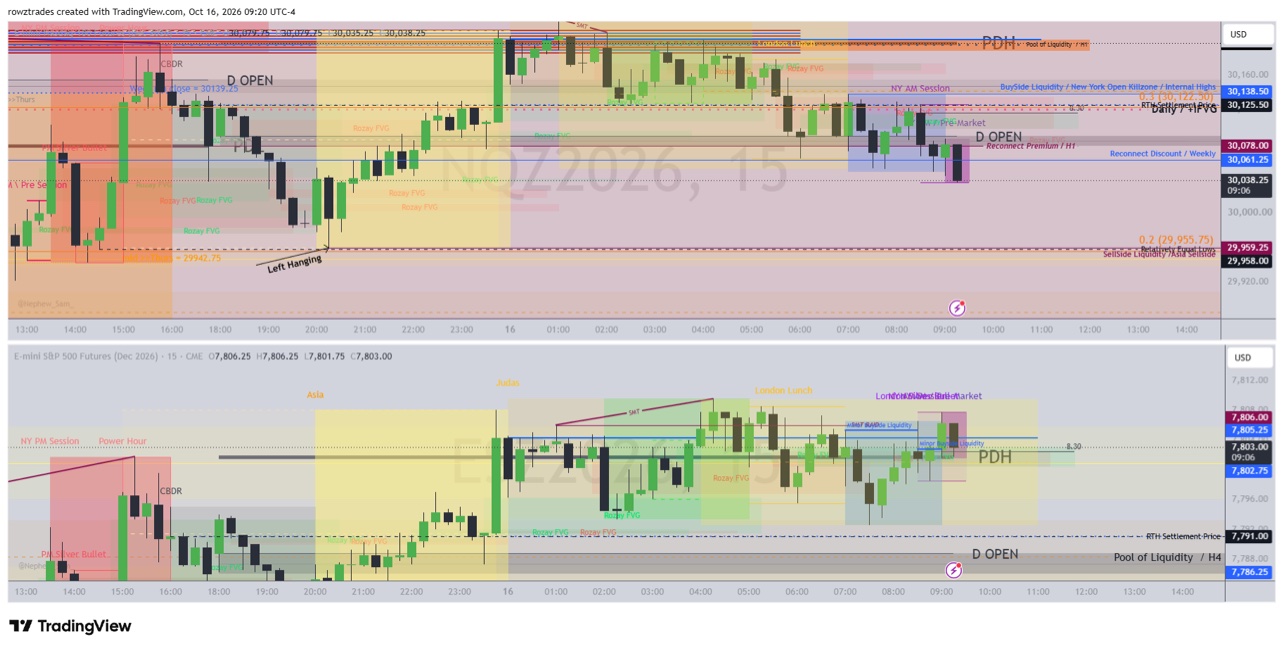
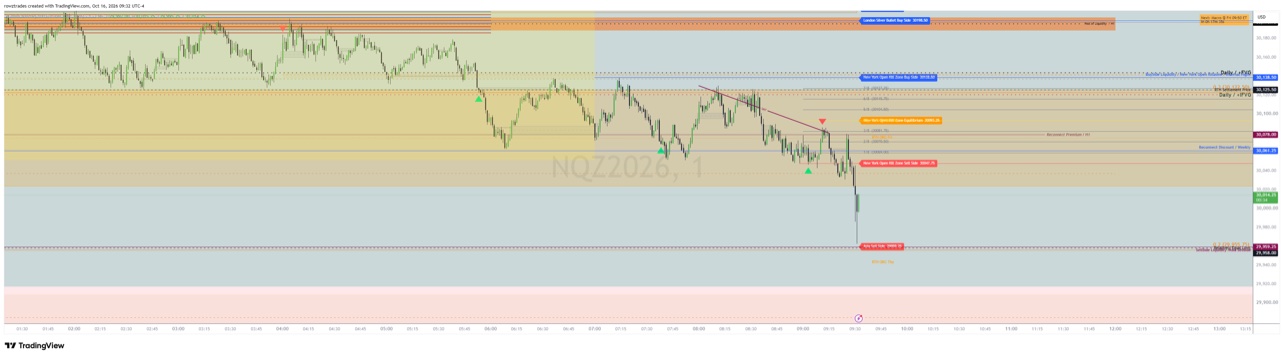
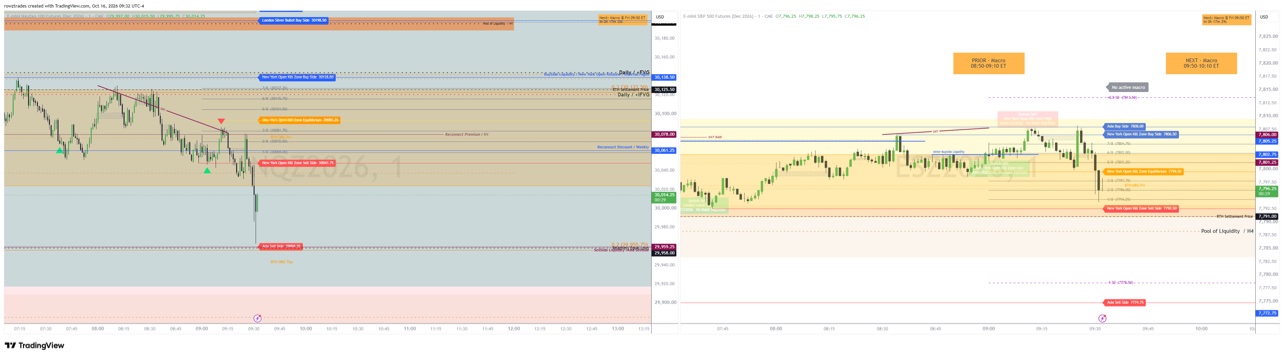
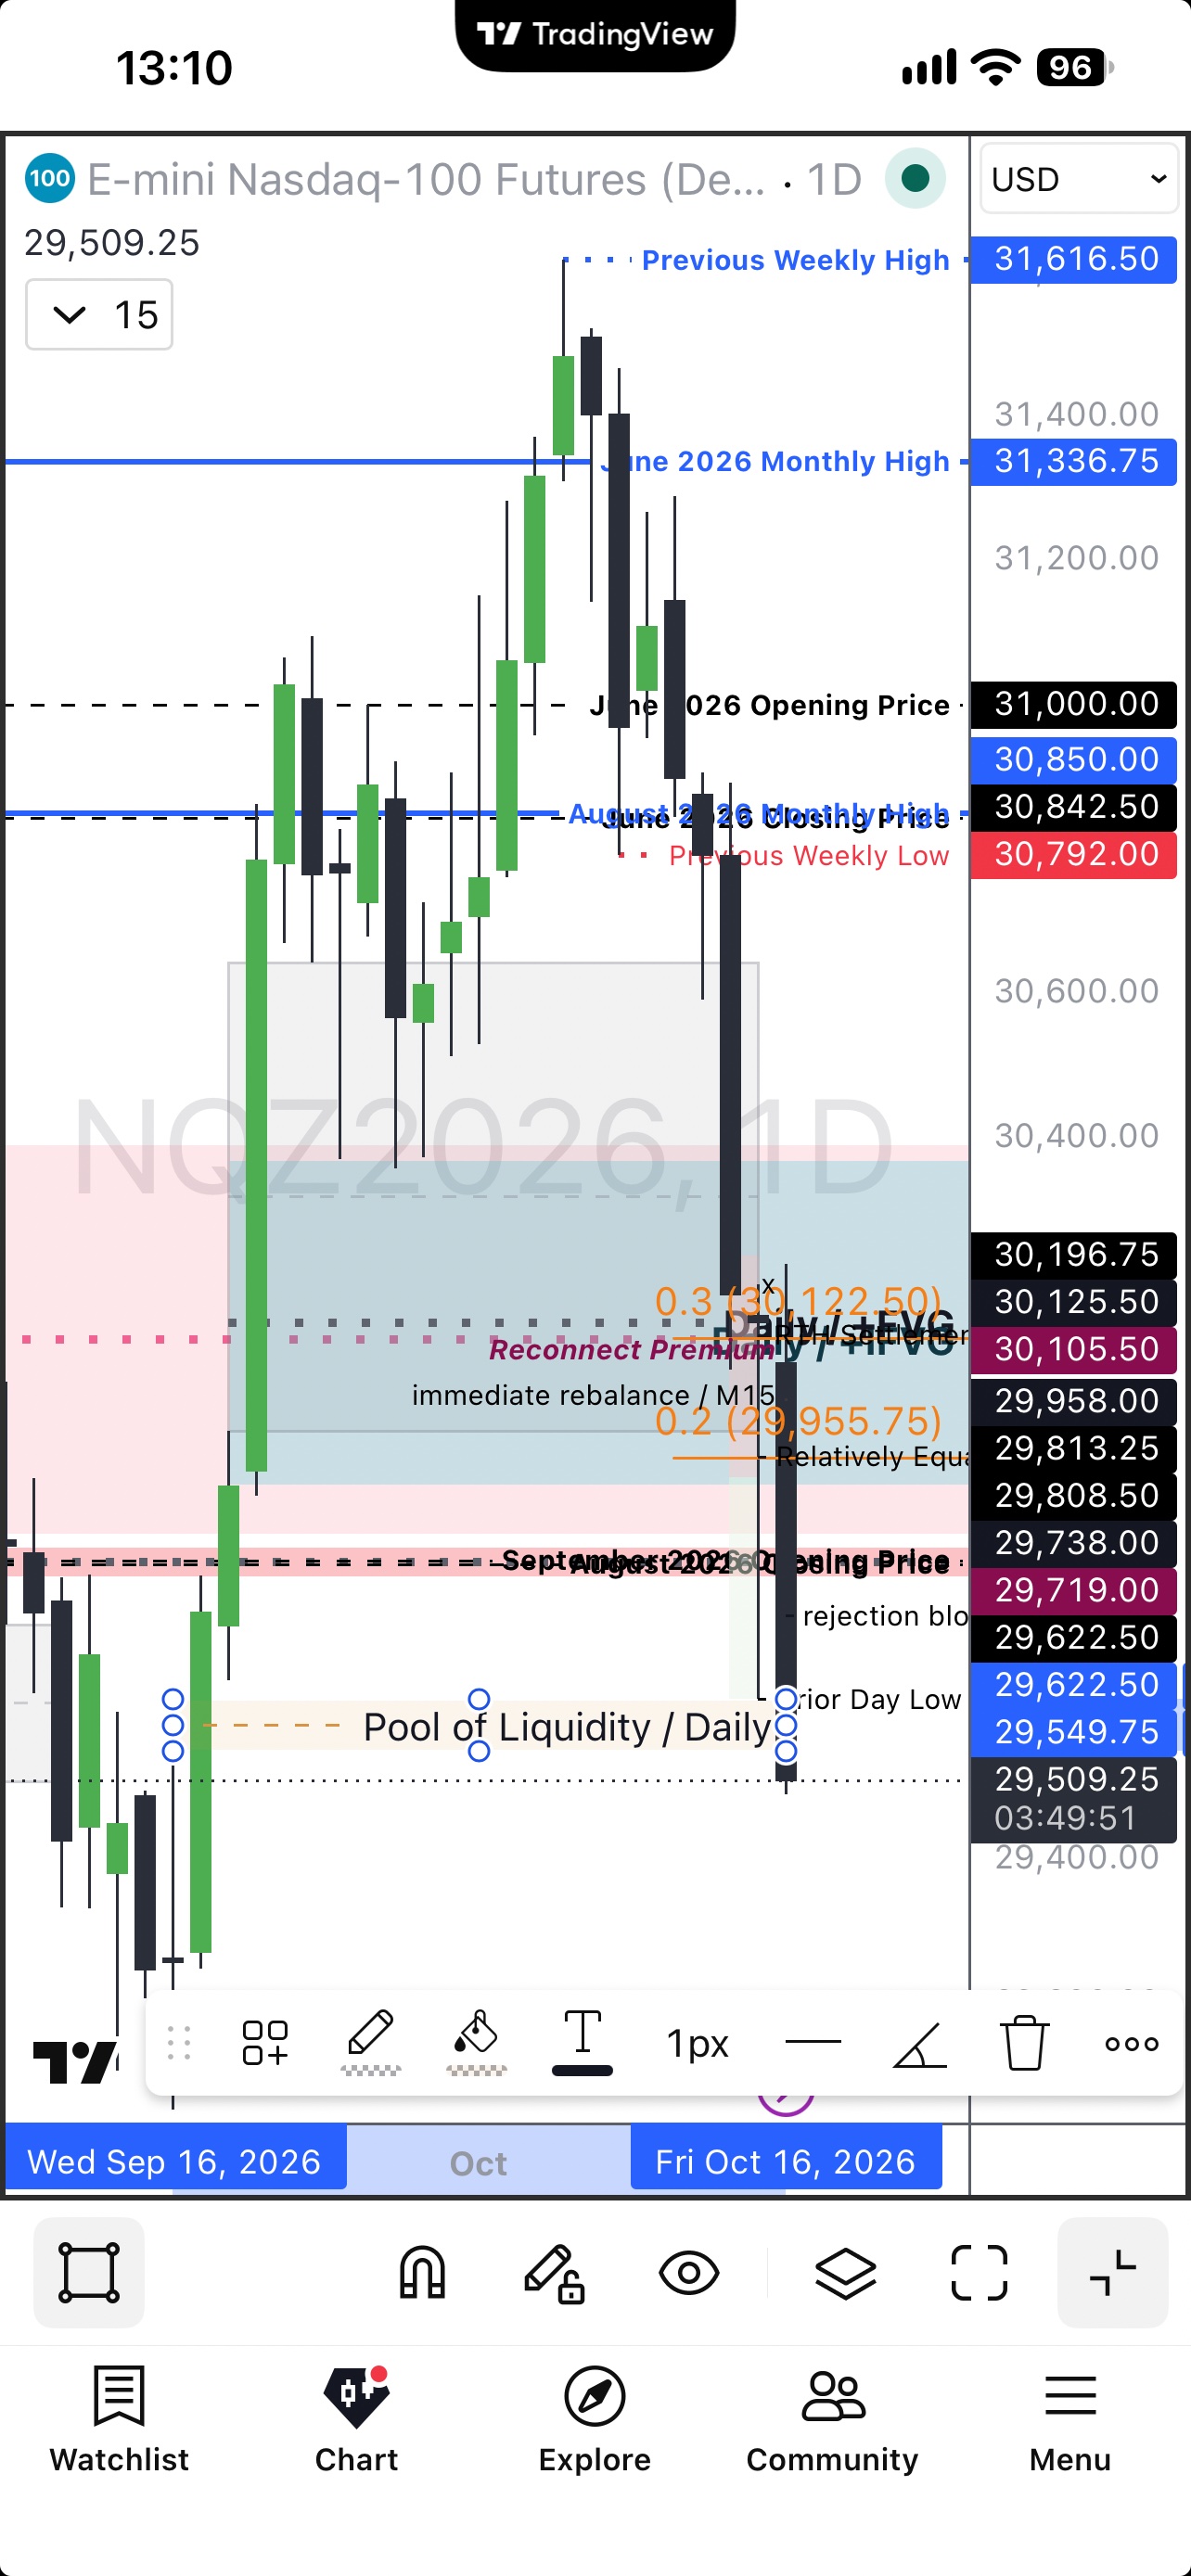
Subsequent delivery. The later charts (09:08, 09:20, 09:40, 09:52) document the bearish expansion and price movement through the identified downside references. Price delivered to the initial liquidity concentration (Left Hanging 29,959.25, relatively equal lows 29,958, Asia sell-side liquidity), continued through the dealing range toward external liquidity, arrived at the Daily Pool’s upper boundary at 29,622.50, and moved beyond it into the remaining Daily PD Array framed by the Daily Pool.
Retrospective observation. Price subsequently extended to 29,509.25, below the prior day low. This extension is a subsequent observation, not part of the pre-move projection. The entire move to 29,509.25 was not specifically projected beforehand. The complete extent of the remaining PD Array is not established by the evidence, and no lower boundary is stated here.
Section 5
Analytical Implications
The October 16 analytical framework identified a downside liquidity objective approximately 562–590 Nasdaq points below the graded reference area. Subsequent price delivery reached that objective and extended farther, producing an observed range of approximately 675–703 points from the same reference area.
The analytical significance lies in the scale of the predefined price objectives. The framework identified successive liquidity references hundreds of Nasdaq points below the initial analytical reference area. These objectives provided a structured basis for evaluating subsequent price delivery across multiple timeframes, independently of whether an execution opportunity was available.
The sequence is the substance of the research: the established dealing range provided structural context; premium and discount established price’s relative position; SMT and the associated timing conditions supported the bearish interpretation; initial sell-side liquidity established the first downside objective; and external liquidity and the higher-timeframe Daily PD Array provided the framework for evaluating continued downside delivery. The framing of the Daily Pool — its upper boundary positioned at the prior day low — was itself the identification of the principal downside objective. The framework organized intraday market conditions into a structure capable of identifying potential price delivery hundreds of Nasdaq points beyond the immediate trading range.
The accompanying execution decision demonstrates a separate principle: identifying the destination does not mean an acceptable entry model must be available. The Analyst establishes the framework, identifies structural relationships, and evaluates potential destinations. The Trader selects and applies an execution model within that framework. A valid directional framework does not automatically produce an acceptable entry. The annotation “Order Filled / No Trade / Didn’t Want to Chase” records the decision not to chase absent a satisfactory entry.
ANALYST LEADS. TRADER OBEYS. RISK MANAGER DECIDES.
One documented case cannot establish that this accuracy is repeatable across market conditions. What this case establishes is that the framework organized market conditions into a coherent map — directional context, structural relationships, and successive liquidity objectives — before the delivery, and that the map’s scale and contemporaneous documentation are verifiable from the preserved evidence.
Research Notes
Method & boundaries
- Sources: timestamped TradingView charts (06:27–09:52, October 16), screen recording (4 minutes 43 seconds, accelerated), and the 13:10 Daily chart. Structural relationships are as stated in the analytical account and the chart evidence.
- Timing: the framework, the initial liquidity objective, and the Daily Pool framing were documented before the delivery; the delivery is documented on the 09:08–09:52 charts and the recording; the extension to 29,509.25 is a retrospective observation.
- The complete extent of the remaining Daily PD Array is not established by the evidence. No lower boundary is stated.
- The annotation “Order Filled / No Trade / Didn’t Want to Chase” records the stated decision not to chase; it does not establish the details of any subsequent execution.
- Handles = Nasdaq points.
- No unsupported execution details are included.
- Chart annotations are preserved as-is; the publication refers to Premium/Discount Arrays generically as PD Arrays.
- Detailed evidence-verification records are retained in the internal research archive.